Home
Locate
CS 101
CS 496
Login
Tutors
Marks
About
Send
Close
Add comments:
(status displays here)
Got it!
This site uses cookies. You consent to this by clicking on "Got it!" or by continuing to use this website.
nbsp; Note: This appears on each machine/browser from which this site is accessed.
Matplotlib: Chart types
by RS
admin@ycp.powersoftwo.org
c
go
java
js
lua
py
vbs
rkt
scm
pro
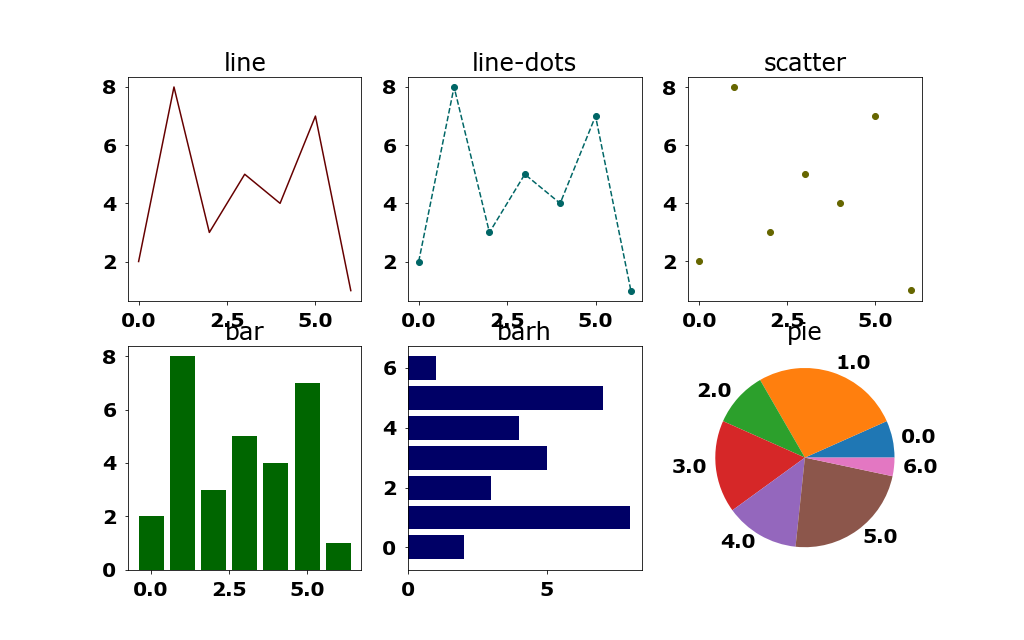
1. Matplotlib: Chart types
There are many possible chart types in Matplotlib. Here are a few.
Line
Dot (scatter)
Bar (vertical)
Bar (horizontal)
Pie (horizontal)
Here is the Python code.
import matplotlib.pyplot as plt import rsPlot rlen1 = 2 clen1 = 3 plot1 = rsPlot.plot("plot19-1",rlen1=rlen1,clen1=clen1,width1=1024,height1=640) ax1 = plot1.ax1 yList1 = [2.0, 8.0, 3.0, 5.0, 4.0, 7.0, 1.0,] xList1 = [0.0, 1.0, 2.0, 3.0, 4.0, 5.0, 6.0,] typeList1 = [ ["#660000","line",], ["#006666","line-dots",], ["#666600","scatter",], ["#006600","bar",], ["#000066","barh",], ["#660066","pie",], ] for i1, (color1,type1) in enumerate(typeList1): rpos1 = i1 // clen1 cpos1 = i1 % clen1 s1 = "{0:s}".format(type1) print("{0:s}".format(s1)) ax2 = ax1[rpos1,cpos1] if type1 == "line": ax2.plot(xList1,yList1,color=color1) elif type1 == "line-dots": ax2.plot(xList1,yList1,color=color1,linestyle="--", marker="o") elif type1 == "scatter": ax2.scatter(xList1,yList1,color=color1,marker="o") elif type1 == "bar": ax2.bar(xList1, yList1,color=color1) elif type1 == "barh": ax2.barh(xList1, yList1,color=color1) elif type1 == "pie": ax2.pie(yList1,labels=xList1) ax2.set_title(s1) plot1.save(tight1=None)
Here is the output of the Python code.
(module rsPlot imported) line line-dots scatter bar barh pie ./plot19-1-01.png : 1024 x 640 , 53,195 bytes
Here is the image for the 2 by 3 grid of example plots.
2. End of page
by RS
admin@ycp.powersoftwo.org