Home
Locate
CS 101
CS 496
Login
Tutors
Marks
About
Send
Close
Add comments:
(status displays here)
Got it!
This site uses cookies. You consent to this by clicking on "Got it!" or by continuing to use this website.
nbsp; Note: This appears on each machine/browser from which this site is accessed.
Clustering example using cities
by RS
admin@ycp.powersoftwo.org
c
go
java
js
lua
py
vbs
rkt
scm
pro
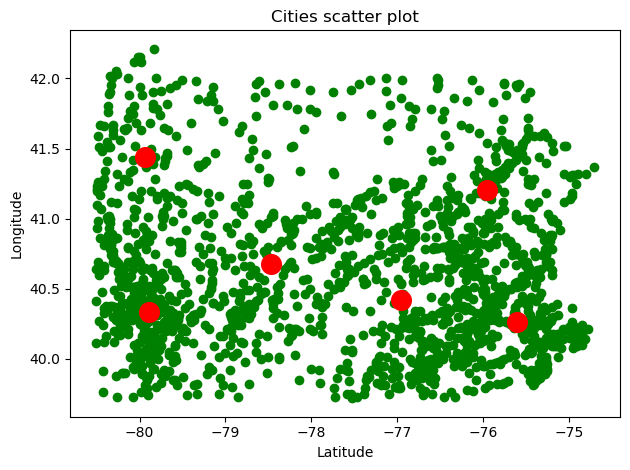
1. Clustering example using cities
Here is an example of clustering using the geographic coordinates of some cities and towns in Pennsylvania.
For the data transformation, see
Location text data conversion
.
2. Python code example
Here is the Python code.
import os import matplotlib as mpl import matplotlib.pyplot as plt from PIL import Image import numpy as np import sklearn as sk from sklearn.datasets import make_blobs from sklearn.cluster import KMeans import json imagePos1 = 0 rlen1 = 1 clen1 = 1 dpi1 = 72 width1 = 640 height1 = 480 figSize1 = (width1 / dpi1, height1/dpi1) fig1, ax1 = plt.subplots(rlen1,clen1,figsize=figSize1,dpi=dpi1) fig1,ax1 = plt.subplots(1,1) centers1 = 6 jsonFs1 = "././mapdata1.json" print("Read: \"{0:s}\"".format(jsonFs1)) with open(jsonFs1,"r") as jsonF1: jsonDict1 = json.load(jsonF1) dataList1 = jsonDict1["data"] dataList2 = [] for (lat1,lng1,city1) in dataList1: dataList2.append([lng1,lat1]) dataArray2 = np.array(dataList2) kmeans1 = KMeans( n_clusters=centers1, init="k-means++", max_iter=300, n_init=10, random_state=0, ) pred_y = kmeans1.fit_predict(dataArray2) plt.scatter( dataArray2[:,0], dataArray2[:,1], c="green", ) plt.scatter( kmeans1.cluster_centers_[:, 0], kmeans1.cluster_centers_[:, 1], s=200, c="red", ) plt.xlabel("Latitude") plt.ylabel("Longitude") plt.title("Cities scatter plot") fig1.tight_layout() imagePos1 += 1 type1 = "png" saveFs1 = "./group23-1-0{0:d}.{1:s}".format(imagePos1,type1) fig1.savefig(saveFs1,bbox_inches="tight") savedImage1 = Image.open(saveFs1) savedWidth1, savedHeight1= savedImage1.size (_, _, _, _, _, _, savedSize1, _, savedTime1, _) = os.stat(saveFs1) print("\t{0:s} : {1:d} x {2:d} , {3:,} bytes".format(saveFs1,savedWidth1,savedHeight1,savedSize1))
Here is the output of the Python code.
Read: "././mapdata1.json" ./group23-1-01.png : 630 x 470 , 66,496 bytes
3. End of page
by RS
admin@ycp.powersoftwo.org