Got it! This site uses cookies. You consent to this by clicking on "Got it!" or by continuing to use this website.nbsp; Note: This appears on each machine/browser from which this site is accessed.
The Gini index, named for Italian statistician Corrado Gini (1884-1965), was developed about 1912.
It is used as a measure of income inequality. The value ranges from 0.0 to 1.0.
0.0 represents perfect equality
1.0 represents perfect inequality.
Interestingly, Gina was developing his ideas at the same time as Pareto in Italy. And, in 1922, Benito Mussolini took over Italy.
2. Pareto principle
The Pareto chart is named after Vilfredo Pareto, 1848-1923, an Italian economist.
3. Pareto Principle
Pareto made the observation that 20% of the population owned 80% of the wealth.
This idea has been called Pareto's principle.
4. Pareto chart
A Pareto chart is a combination chart that shows an individual count or frequency using a column bar chart, ordered in decreasing order from left to right, and a cumulative distribution using a line chart.
5. Bruno de Finetti
Another Italian statistician, Bruno de Finetti (1902-1985) did important work in the field of "infinite measures" (Dirichlet distribution, stick breaking, etc.) that forms the theoretical basis of some aspects of LDA (Latent Dirichlet Allocation) as a generative Bayesian method.
6. Dirichlet process
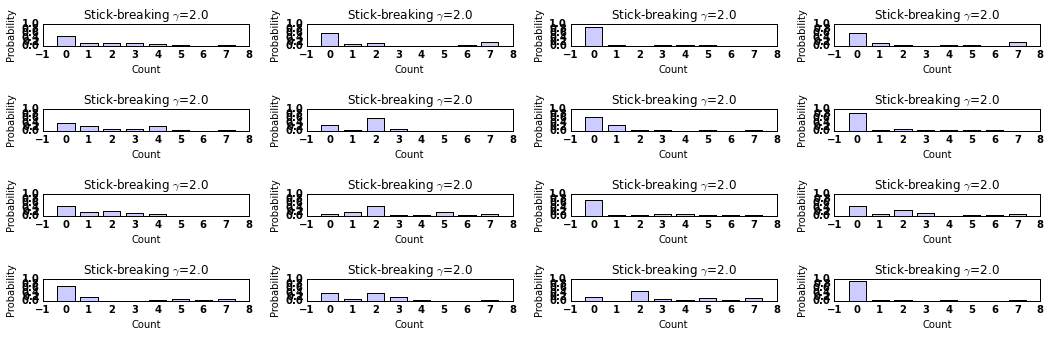
A common way to get a Dirichlet process for "infinite measures" is via a simple stick breaking algorithm.
Another way is the Polya urn scheme.
7. Stick breaking
Break a stick randomly in half. Use one part. Then break the other part in half. Use one part. Continue until the desired number of values are obtained.
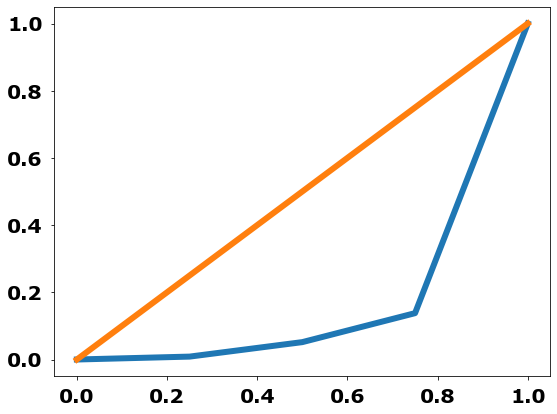
8. Gini index depiction
Back to the Italian statistician Gini.
Here is a graphical depiction of the Gini coefficient from the Wikipedia page on the "Gini coefficient".
9. Lorenz curve
The Gini index can be represented graphically with the Lorenz curve.
10. Gini index
Formula is from the Wikipedia page on the Gini Coefficient.
 Pareto made the observation that 20% of the population owned 80% of the wealth.
 A Pareto chart is a combination chart that shows an individual count or frequency using a column bar chart, ordered in decreasing order from left to right, and a cumulative distribution using a line chart.
 Break a stick randomly in half. Use one part. Then break the other part in half. Use one part. Continue until the desired number of values are obtained.
 Formula is from the Wikipedia page on the Gini Coefficient.