Got it! This site uses cookies. You consent to this by clicking on "Got it!" or by continuing to use this website.nbsp; Note: This appears on each machine/browser from which this site is accessed.
M&M's is a registered trademark of Mars, Inc. For more information, see http://www.mms.com [as of 0, 1 11, 2004].
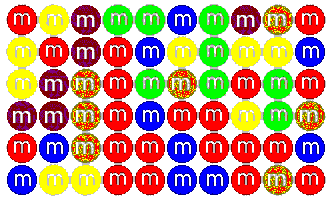
2. A typical package of M&M's
An M&M represents one data sample from one package of M&M's. Here, it is assumed that a package of M&M's contains 60 M&M's.
The M&M colors represent nominal data in that there is preferred ordering or numerical value that can be associated with the M&M's.
3. A package in text form
Here is a typical package contents in text form.
Red Yellow Brown Green Green Blue Green Brown Orange Red
Yellow Red Brown Red Blue Yellow Green Yellow Yellow Blue
Yellow Brown Orange Red Green Orange Green Red Green Red
Brown Brown Orange Red Blue Red Red Yellow Green Orange
Red Blue Orange Red Red Blue Red Red Red Blue
Blue Yellow Yellow Red Red Blue Blue Red Orange Red
4. Package in list form
Here is the raw data for this problem as a list of colors.
Red
Yellow
Brown
Green
Green
Blue
Green
Brown
Orange
Red
Yellow
Red
Brown
Red
Blue
Yellow
Green
Yellow
Yellow
Blue
Yellow
Brown
Orange
Red
Green
Orange
Green
Red
Green
Red
Brown
Brown
Orange
Red
Blue
Red
Red
Yellow
Green
Orange
Red
Blue
Orange
Red
Red
Blue
Red
Red
Red
Blue
Blue
Yellow
Yellow
Red
Red
Blue
Blue
Red
Orange
Red
5. Getting data into the computer
Often, a TPS (Transaction Processing System) is used to automatically collect the data and put it into the computer.
A spreadsheet can be used as a TPS.
A database can be used as a TPS.
A program can be used as a TPS.
It is better to automate the collection of data rather than use a human to manually enter data into the computer.
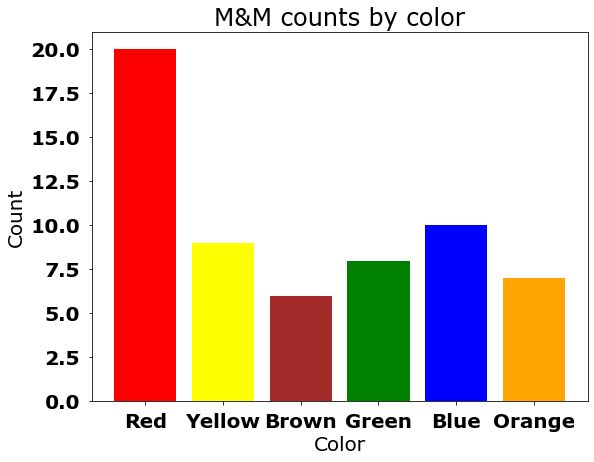
6. Python program
One could write a Python program to summarize the data by color.
But there are some built-in ways to summarize the data.
Here is the Python code.
Here is the output of the Python code.
7. Pareto principle
The Pareto chart is named after Vilfredo Pareto, 1848-1923, an Italian economist.
8. Pareto Principle
Pareto made the observation that 20% of the population owned 80% of the wealth.
This idea has been called Pareto's principle.
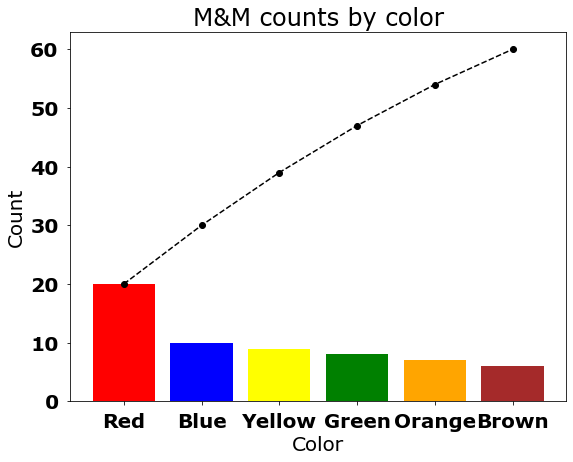
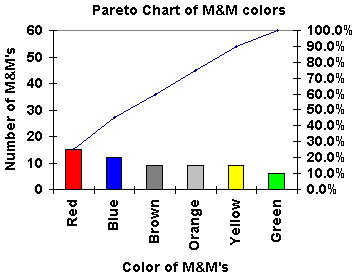
9. Pareto chart
A Pareto chart is a combination chart that shows an individual count or frequency using a column bar chart, ordered in decreasing order from left to right, and a cumulative distribution using a line chart.
10. Pareto chart
To get a Pareto chart, the following changes need to be made.
The colors need to be sorted in descending order by count.
A cumulative line graph needs to be added.
Here is the Python code.
Here is the output of the Python code.
11. Summary
The above has shows some ways of summarizing nominal data using the M&M problem.
 An M&M represents one data sample from one package of M&M's. Here, it is assumed that a package of M&M's contains 60 M&M's.
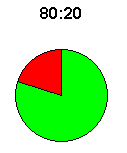 Pareto made the observation that 20% of the population owned 80% of the wealth.
 A Pareto chart is a combination chart that shows an individual count or frequency using a column bar chart, ordered in decreasing order from left to right, and a cumulative distribution using a line chart.